


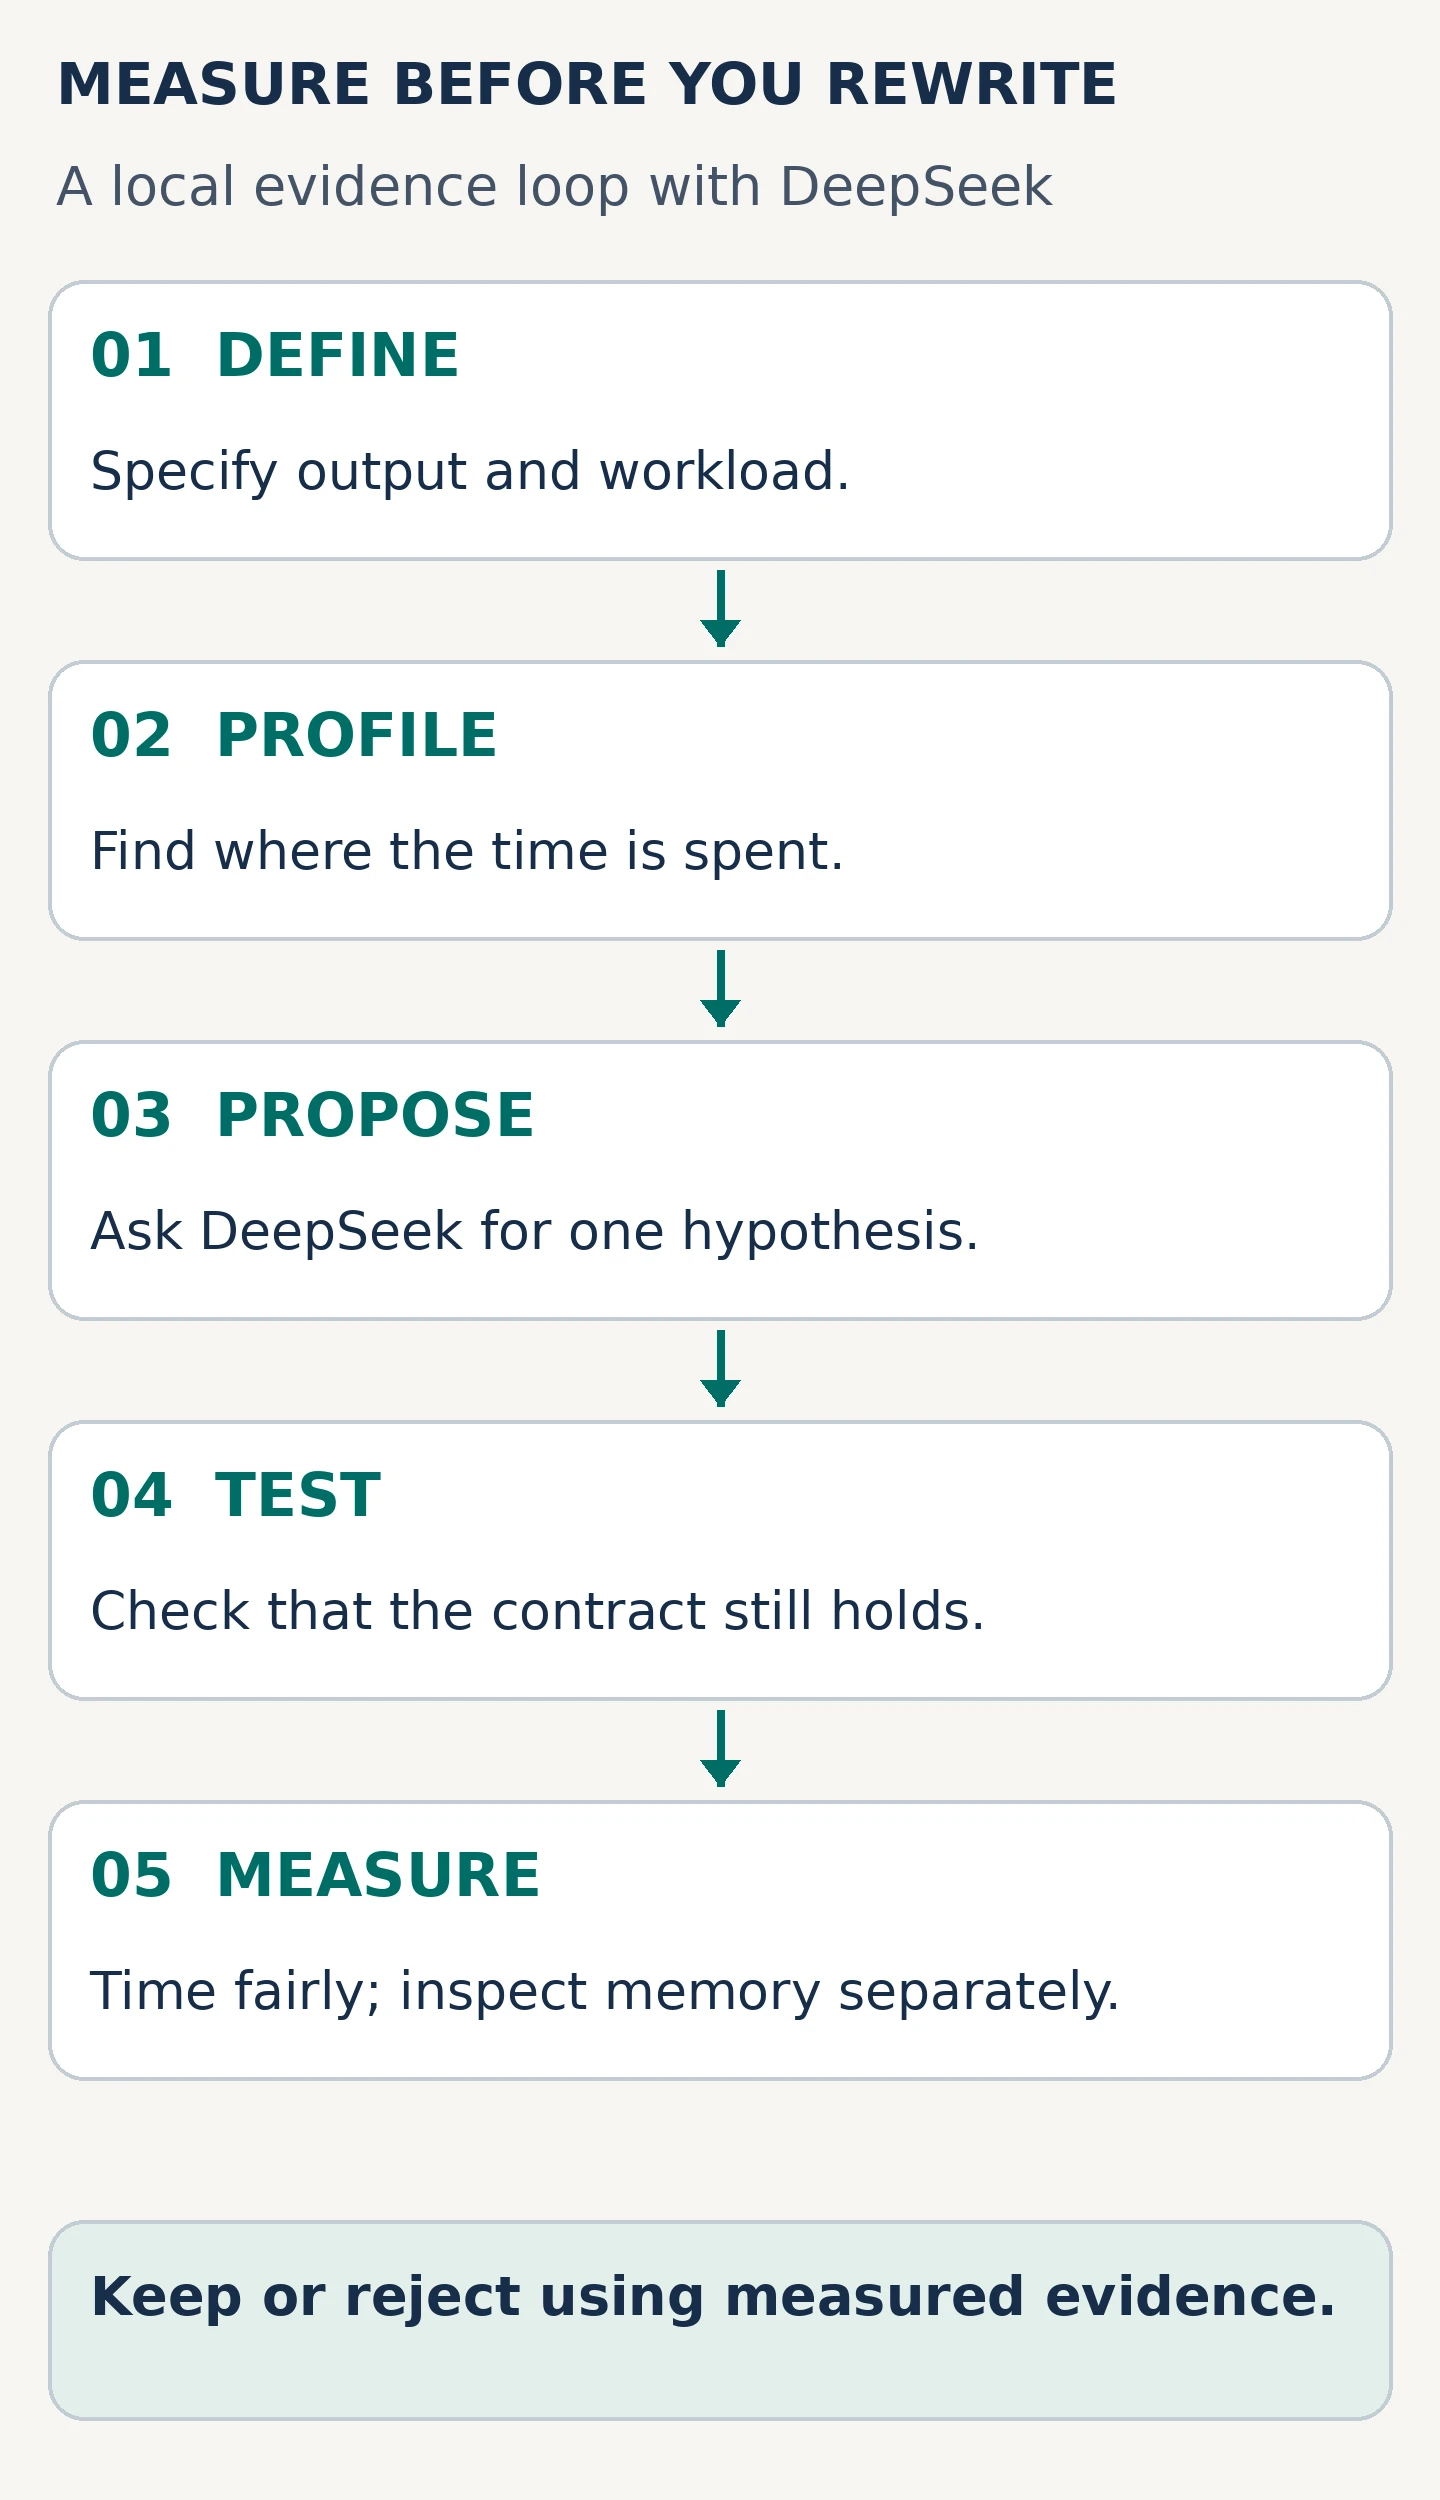
A useful AI-assisted optimization starts with a behavior you can describe and a delay you can reproduce. Give DeepSeek those two things, plus a small amount of measured evidence, and it can help you investigate a slow Python path. Give it only a function and a request to make it faster, and you have left the hardest questions unanswered: faster for which inputs, measured over which operation, and with which behavior preserved?
This lesson develops a local, standard-library workflow around a deliberately small enrichment task. Each event contains a product identifier. A catalog supplies its label. The original implementation searches the catalog for every event; a candidate builds an index once per call. The interesting work is deciding whether that rewrite is equivalent, whether its construction cost belongs in the measurement, and whether its additional memory is acceptable.
DeepSeek’s role is to propose explanations, identify missing tests, and review the evidence. Your Python process supplies the measurements. The prompt templates below are author-written examples, not transcripts or model responses. No DeepSeek API call is part of the example, and no model performance or universal speedup is claimed. You can follow the entire experiment locally before deciding whether to share a sanitized summary with an approved AI service.
Run the example: Download the Python performance lab (ZIP, about 12 KB). It contains the complete standard-library script, tests, README and recorded local outputs. Extract it and run the commands from its folder with Python 3.10 or later. Only CPython 3.12.14 was tested here. The short code excerpts below belong to these supplied files; they are not separate standalone programs.
1. Define the behavior before the performance target
Begin with the contract that a faster implementation must satisfy. In this example an event is a two-item tuple containing an event ID and a product ID. A catalog row contains a product ID and a label. Both inputs are lists of these immutable tuples. IDs are ordinary strings with a maximum length of 64 characters, and labels are strings. These are prevalidated inputs; the enrichment functions do not implement a validation layer. Keeping that boundary explicit prevents an optimization from quietly introducing a different data model.
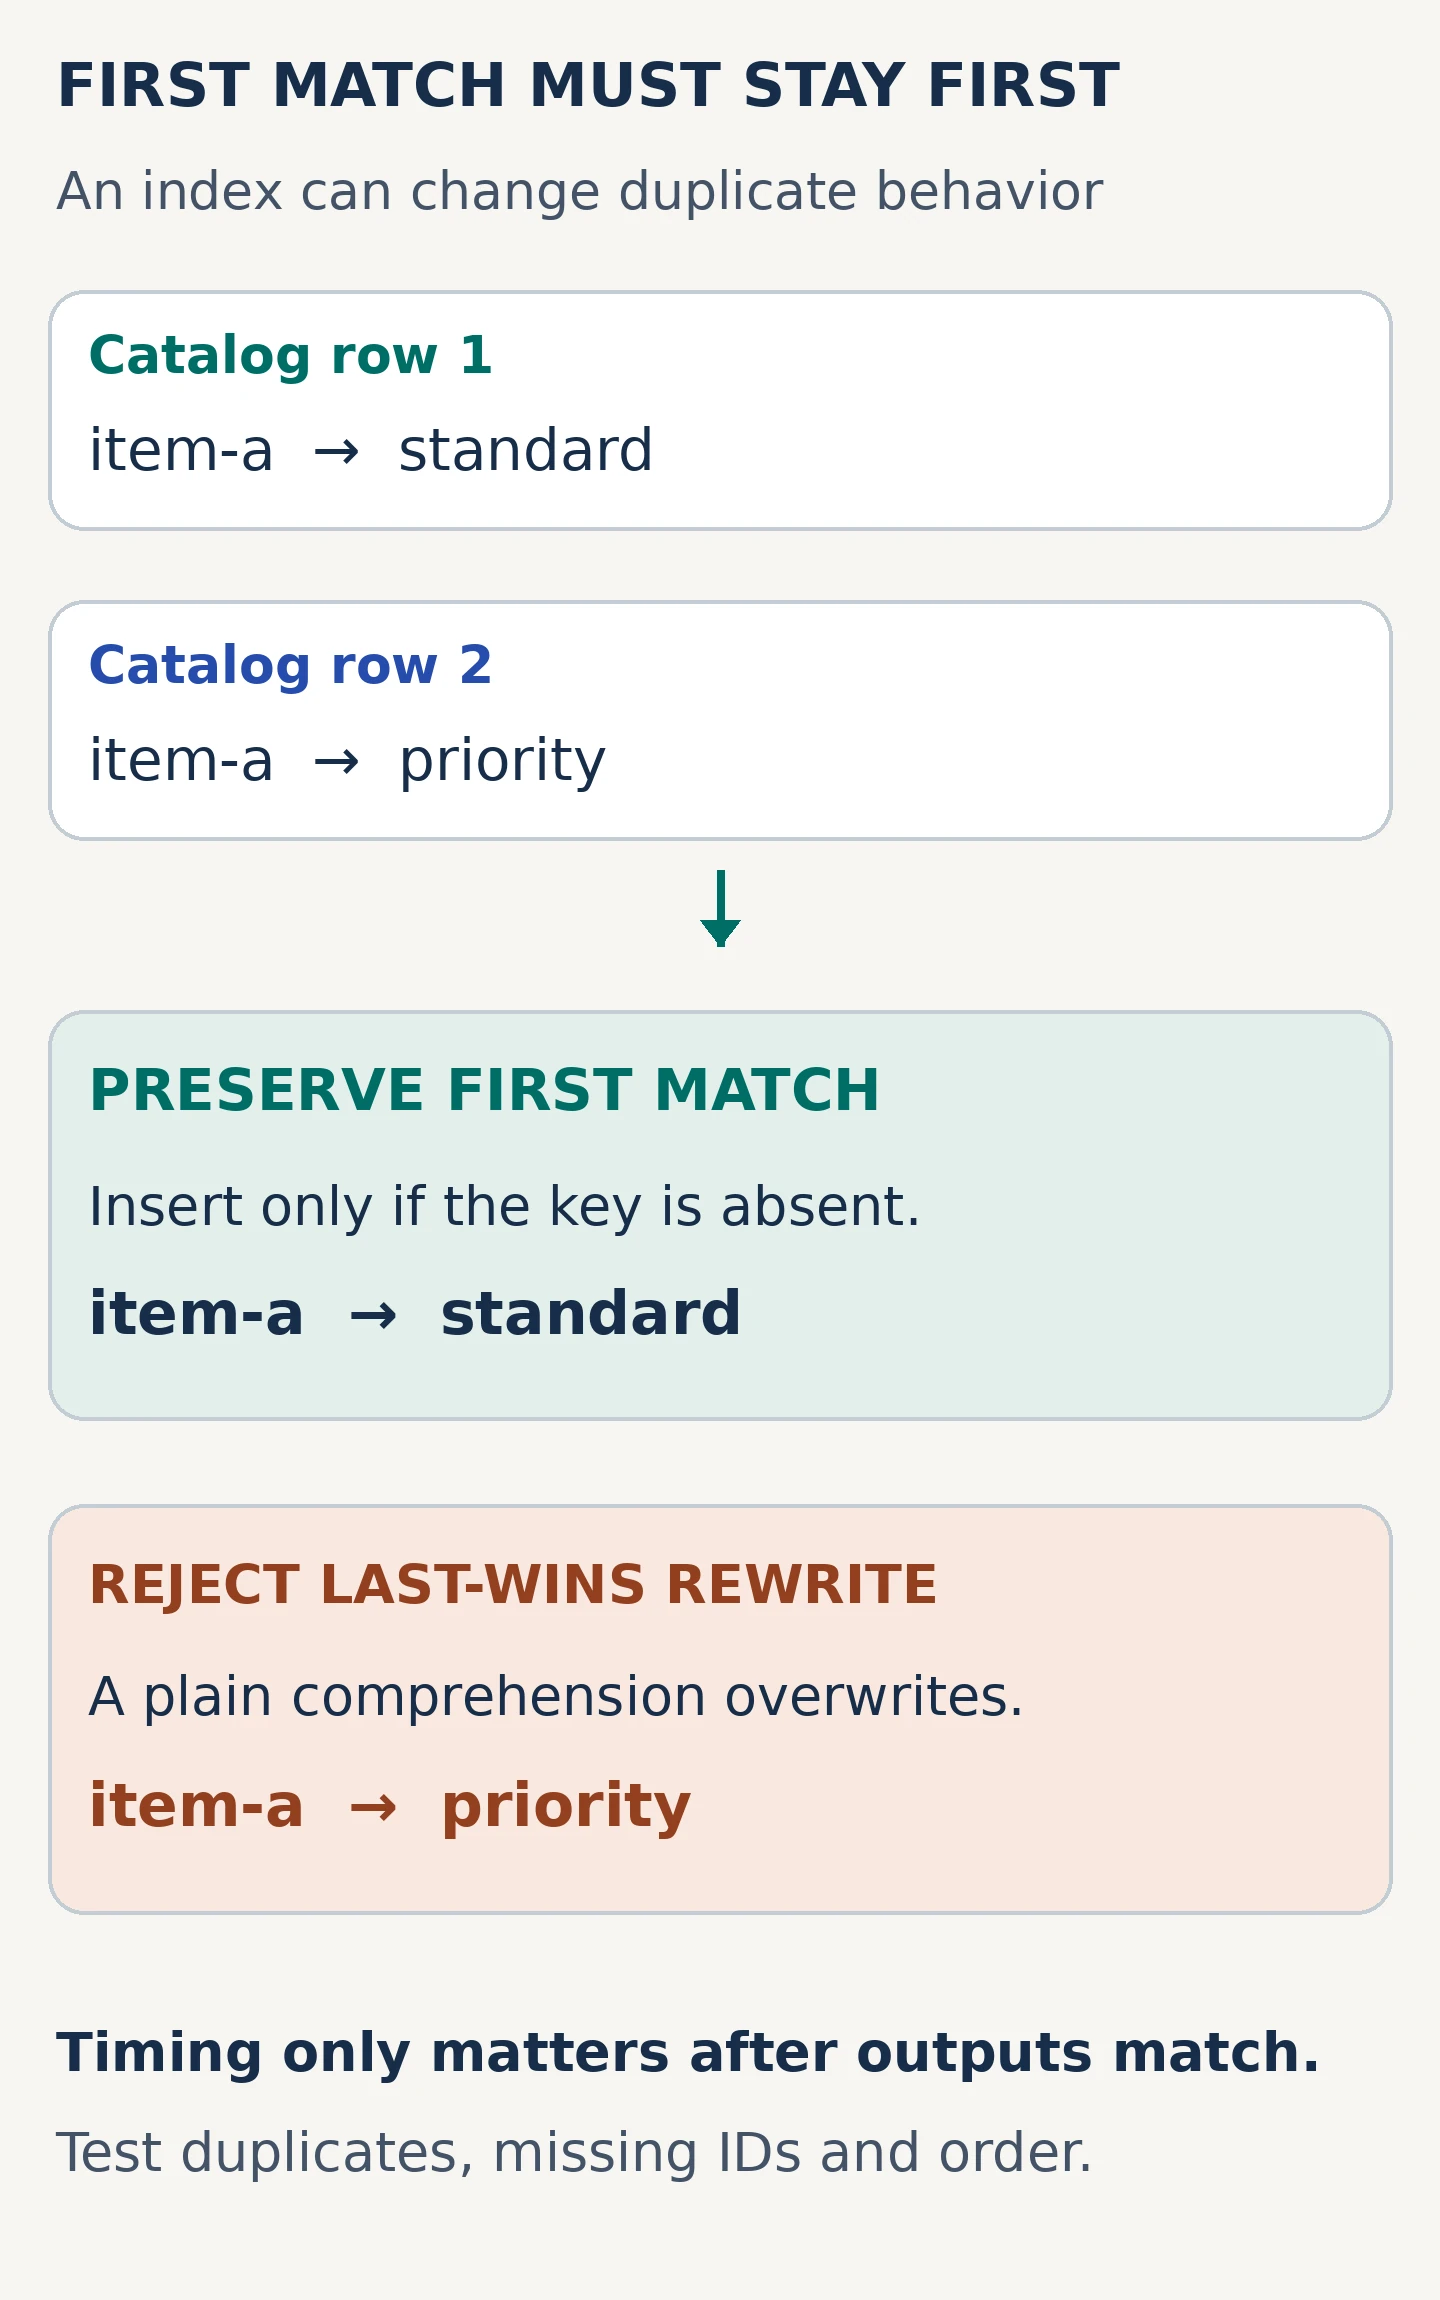
The output is a fresh list of three-item tuples: event ID, product ID, and label. Every input event produces exactly one output, in its original position. Repeated events remain repeated. If a product does not appear in the catalog, its label is None. An existing empty string is a valid label and must stay an empty string. If several catalog rows share a product ID, the first matching row wins. Neither input list may be modified.
That duplicate rule is easy to overlook because a short catalog often contains unique IDs. Yet the original scan stops at the first match, making catalog order observable. A replacement that retains the final duplicate changes the answer even when its output length and types look correct. Similarly, dropping unknown products can improve a benchmark while breaking the requirement to preserve all events. Write those requirements down before viewing a candidate, so the candidate does not accidentally redefine success.
Set a separate performance objective at the application boundary. A batch deadline, a memory limit, or a measured latency target can justify the work. Avoid selecting an arbitrary speedup ratio because it sounds impressive. A function that saves a substantial fraction of its own runtime may still have little effect on the process that calls it. Record the relevant workload sizes and the constraint you want to improve; leave the expected numerical outcome blank until you measure it.
2. Make the baseline reproducible and worth comparing
Keep the scanning implementation as a readable reference. It walks through the events, scans the catalog for each product, stops at the first match, and appends an output tuple. This gives you an implementation whose semantics are visible enough to inspect by hand. Do not first refactor it into several clever helpers or change its missing-value behavior. You want to know exactly which behavior the optimized version is replacing.
Event = tuple[str, str]
CatalogRow = tuple[str, str]
Enriched = tuple[str, str, str | None]

def enrich_scan(events: list[Event], catalog: list[CatalogRow]) -> list[Enriched]:
    result = []
    for event_id, product_id in events:
        label = None
        for candidate_id, candidate_label in catalog:
            if candidate_id == product_id:
                label = candidate_label
                break
        result.append((event_id, product_id, label))
    return result
A reproducible workload needs more than two list lengths. Specify how frequently event products are absent, how many distinct products appear, where successful matches occur in the catalog, and how duplicates are arranged. A scan over mostly early matches behaves differently from a scan over mostly absent products, even with identical event and catalog counts. Long repeated runs against the same objects also differ from calls that receive newly loaded data. These differences should appear in the experiment description.
Generate a deterministic synthetic dataset outside the region you intend to measure. Save its seed and generation rules alongside the code. A seed makes a particular generator repeatable; it does not make the dataset representative by itself. Build several deliberately different cases, including small batches, many misses, many early hits, and repeated products. For the instructional example, synthetic identifiers are sufficient. A production investigation may need aggregate characteristics from real workloads, but it should not require exposing actual customer rows.
The supplied lab’s default fixture contains 6,000 events and 2,000 catalog rows representing 1,000 distinct products. Each original catalog row is followed later by a duplicate with a different label, and every fifth event references an unknown product. The seed is 20261004. That arrangement makes duplicate handling and missed lookups visible while remaining fully synthetic. It is a teaching workload, not a sampled production distribution.
Record the Python implementation and version, operating system, machine context, and exact command. Save the original source revision so another person can run the same baseline after the candidate changes. Also note whether the machine was heavily loaded and whether the workload fits comfortably in memory. You cannot eliminate every environmental influence, but you can make the comparison auditable. A precise description of an ordinary laptop run is more useful than an unexplained result labeled simply “Python benchmark.”
3. Profile the operation that is actually slow
Use cProfile to investigate where execution time goes. Python’s documentation describes it as a deterministic profiler and recommends separating profiling from benchmarking. The profiler observes calls and adds overhead, so a profile is an instrumented view of execution rather than an unmodified stopwatch result. Run the baseline under the profiler to choose an investigation target, then use a separate timing run to judge a proposed improvement.
python performance_lab.py demo
python performance_lab.py profile
The profile mode wraps only the scan call in cProfile.Profile.runcall, then prints its cumulative-time report. Fixture generation is outside that boundary.
Choose the measured boundary intentionally. If the complaint concerns an entire import job, first inspect that job rather than assuming enrichment is its dominant cost. Parsing, validation, file reads, and output serialization can consume most of the elapsed time. Once a broader profile supports investigating enrichment, a narrower run can make the relevant functions easier to understand. Keep both perspectives: the narrow profile explains the mechanism; the broader measurement establishes whether the change matters.
For the local example, prepare events and catalog rows before entering the profiled enrichment call. Otherwise the generator may dominate the report and answer a different question. Keep printing and report formatting outside that call as well. If your real requirement includes loading the catalog on every request, add a separate end-to-end experiment that includes loading. Removing setup from a function experiment is legitimate only when its label clearly says what the experiment covers.
Run a workload long enough for the relevant path to be visible, without making the first investigation needlessly expensive. If the report shows a large number of repeated lookups, inspect the code responsible before requesting a rewrite. A small profile and the corresponding function are usually a better discussion starting point than a full application dump. Keep the original profile locally so later summaries can be checked against the actual observation.
4. Read self time and cumulative time without double counting
In a standard profile report, tottime is time attributed to the function itself, excluding its subcalls. cumtime includes the function and calls beneath it. Call counts supply another clue: a modest cost repeated many times may matter more than an expensive operation executed once. Sort once by cumulative time to find costly call paths and again by internal time to identify work occurring inside individual functions. The pstats module provides these views.
Suppose a wrapper calls the enrichment function and does almost nothing else. Both can have large cumulative values because the wrapper includes the enrichment call. Adding their cumulative times would count overlapping work twice. Conversely, a wrapper with little self time is not necessarily an unimportant boundary; it may represent exactly the operation whose latency a user experiences. Read the report as a call structure, not a list of independent charges to add together.
Our scanning loop lives largely inside one Python function, so a function-level report may identify that function without separating each comparison inside it. This is still useful. The source explains that the catalog is revisited for each event, and an input-size experiment can test whether that repeated work drives growth. You do not need to pretend the profiler measured every line. If multiple independent operations share the function, a temporary, behavior-preserving split can help isolate them for investigation.
Ask what observation would contradict your interpretation. If enrichment consumes only a small portion of the end-to-end duration, the next optimization may belong elsewhere. If changing catalog size barely changes the scan time, inspect match positions, batch size, and the measurement boundary. If the candidate moves cost into index construction, ensure that construction still appears in the operation you time. A report is valuable when it narrows the next experiment, not when it gives a plausible story a scientific appearance.
5. Send DeepSeek a small sanitized evidence packet
An evidence packet should let a reviewer understand the contract, the observed cost, and the limits of the observation without reconstructing your environment. Include the relevant function, Python version, data shape, workload sizes, hit and miss characteristics, a short profile excerpt, and the command that produced it. State what is excluded from the measurement. Include the existing correctness tests or summarize their assertions. If timing results do not exist yet, say so explicitly.
Sanitization extends beyond replacing customer names. Profile reports can contain developer usernames in paths, internal module names, project identifiers, and service names. Source comments may contain ticket links or business details. Remove secrets and private data, and replace unnecessary identifiers consistently so the example remains understandable. A synthetic minimal reproduction is often easier to reason about than heavily redacted production code. Keep the mapping back to real systems local.
Do not assume a prompt asking for confidentiality changes a provider’s actual handling of the submitted content. Use only an approved service and a sharing scope your organization permits. DeepSeek’s official API documentation is the appropriate place to verify current integration details if you later automate the interaction; this local lesson needs no API credentials. For a broader checklist before sharing code, consult the site’s DeepSeek API privacy and data-minimization guidance.
Set a narrow request: identify a few testable hypotheses and recommend the next measurement. Asking for an immediate complete rewrite makes it easier to skip the reasoning that connects the profile to a change. Require the answer to separate observations supplied in your packet from inferences about the code. This gives you a practical review handle when a model sounds more certain than the evidence permits.
6. Turn a suggestion into one testable change
The hypothesis for this example is specific: repeatedly scanning the catalog performs avoidable matching work, and a first-match index may reduce the total cost for some workloads. This statement predicts a mechanism and leaves room for a negative result. A tiny event batch may not justify constructing an index. A catalog whose successful matches are concentrated at the beginning can make the scan less expensive than its worst case suggests. The candidate deserves measurement under both favorable and unfavorable conditions.
Distinguish complexity from measured runtime. With E events and C catalog rows, a scan can perform work proportional to E multiplied by C when searches go through the catalog. Under the stated bounded-string assumptions and ordinary dictionary behavior, constructing an index and then looking up each event has expected work proportional to C plus E. These descriptions explain scaling tendencies. They do not supply a speedup factor, a crossover point, or a guarantee about a particular interpreter and input.
Keep the first patch narrow. Replace lookup strategy while preserving input validation boundaries, output construction, and public behavior. Do not simultaneously introduce asynchronous execution, parallel workers, a new storage format, and several caches. Each additional change creates another possible explanation for both performance movement and failures. A small patch lets a failed test or surprising measurement teach you something rather than sending you through a large bundle of unrelated edits.
DeepSeek can review the proposed mechanism and suggest counterexamples, but the decision belongs in your experiment notes. Write down what you expect to change, the cost you expect to add, and the result that would make you reject the patch. For indexing, the added costs include constructing and retaining the dictionary during the call. Including those costs before you run anything helps resist the temptation to report only the measurement where the candidate wins.
7. Build an index that preserves the first catalog match
The implementation uses dict.setdefault while walking the catalog in order. An unseen product ID receives its label; an existing product ID keeps its previously stored label. This matches the scan’s first-hit behavior. A dictionary comprehension assigning each product to its label would instead overwrite earlier values when duplicates occur. The shorter expression is attractive, but it would implement a different contract.
def enrich_indexed(events: list[Event], catalog: list[CatalogRow]) -> list[Enriched]:
    first_label = {}
    for product_id, label in catalog:
        first_label.setdefault(product_id, label)
    return [(event_id, product_id, first_label.get(product_id))
            for event_id, product_id in events]
Once the index exists, walk the events in their original order and append one output tuple for each event. Output order comes from iterating the event list, not from iterating the dictionary. Repeated event IDs and product IDs therefore remain present. Looking up an absent product supplies None, while a stored empty string is returned unchanged. Avoid a truthiness fallback such as replacing any false-like label with a missing marker; that would erase a legitimate empty label.
The input restriction matters. A scan can compare some values that cannot serve as dictionary keys, while the indexed version requires hashable keys. This example deliberately accepts plain strings, so the rewrite stays within that contract. If your real application accepts lists, custom objects with unusual equality, or loosely typed mixed identifiers, resolve that behavior before borrowing the optimization. Converting every identifier to a string is a semantic change, not a free compatibility repair.
The candidate creates a fresh dictionary and output list for each call. It does not sort the catalog, edit either input list, or attach cached state to an input object. This is intentionally a simple lifetime model. A retained index could be a worthwhile next design, but it would need a rule for catalog changes and ownership. First establish the correctness and full-call cost of the local rewrite. You then have a stable basis for deciding whether the additional complexity of reuse is justified.
8. Test the awkward cases before timing the candidate
Start with examples whose expected outputs you can write independently. Cover empty events, an empty catalog, one match, one miss, repeated events, and several products in a deliberate order. Give a duplicate product two different labels and assert that the earlier one wins. Include an empty first label followed by a nonempty duplicate so the test catches both accidental overwriting and truthiness-based fallbacks. Equality of the entire output list checks order and multiplicity together.
Check that both input lists still equal copies captured before each call. Because this example uses immutable tuples of strings, a shallow list copy is sufficient for that specific comparison. That would not establish the same guarantee for a structure containing mutable nested dictionaries. Also call the function more than once and compare outputs, so unintended state left over from a previous invocation has a chance to surface. Tests should reflect the actual data contract rather than a generic assertion that nothing was mutated.
python -m unittest -v test_performance_lab.py
Expand the complete correctness test file
"""Contract tests; independent expected values plus deterministic equivalence cases."""
import copy
import random
import unittest

from performance_lab import enrich_indexed, enrich_scan, make_data


def incorrect_last_wins(events, catalog):
    labels = dict(catalog)  # Deliberately wrong when catalog IDs repeat.
    return [(event_id, product_id, labels.get(product_id))
            for event_id, product_id in events]


class EnrichmentContractTests(unittest.TestCase):
    functions = (enrich_scan, enrich_indexed)

    def check_both(self, events, catalog, expected):
        for fn in self.functions:
            with self.subTest(function=fn.__name__):
                before = copy.deepcopy((events, catalog))
                result = fn(events, catalog)
                self.assertEqual(result, expected)
                self.assertEqual((events, catalog), before)
                self.assertIsNot(result, events)
                self.assertIsNot(result, catalog)

    def test_first_match_order_repeats_and_missing(self):
        events = [("e3", "p2"), ("e1", "p1"), ("e2", "missing"), ("e1", "p1")]
        catalog = [("p1", "first"), ("p2", "second"), ("p1", "later")]
        expected = [("e3", "p2", "second"), ("e1", "p1", "first"),
                    ("e2", "missing", None), ("e1", "p1", "first")]
        self.check_both(events, catalog, expected)

    def test_empty_inputs(self):
        self.check_both([], [], [])
        self.check_both([], [("p1", "one")], [])
        self.check_both([("e1", "p1")], [], [("e1", "p1", None)])

    def test_empty_and_unicode_ids_and_labels(self):
        events = [("", ""), ("é", "商品"), ("e3", "x" * 64), ("e4", "P1")]
        catalog = [("", ""), ("", "later"), ("商品", "茶"), ("x" * 64, "long"), ("p1", "lower")]
        expected = [("", "", ""), ("é", "商品", "茶"), ("e3", "x" * 64, "long"), ("e4", "P1", None)]
        self.check_both(events, catalog, expected)

    def test_last_wins_candidate_is_rejected(self):
        events = [("e1", "p1")]
        catalog = [("p1", "first"), ("p1", "later")]
        expected = [("e1", "p1", "first")]
        with self.assertRaises(AssertionError):
            self.assertEqual(incorrect_last_wins(events, catalog), expected)
        self.check_both(events, catalog, expected)

    def test_output_list_does_not_alias_inputs(self):
        for fn in self.functions:
            events, catalog = [("e1", "p1")], [("p1", "one")]
            result = fn(events, catalog)
            result.append(("e2", "p2", "two"))
            self.assertEqual(events, [("e1", "p1")])
            self.assertEqual(catalog, [("p1", "one")])

    def test_250_deterministic_generated_cases(self):
        rng = random.Random(90210)
        ids = ["", "p0", "p1", "p2", "商品", "x" * 64]
        for case in range(250):
            catalog = [(rng.choice(ids), rng.choice(["", "alpha", "beta", "茶"]))
                       for _ in range(rng.randrange(25))]
            events = [(f"e{rng.randrange(6)}", rng.choice(ids + ["missing"]))
                      for _ in range(rng.randrange(30))]
            with self.subTest(case=case):
                self.check_both(events, catalog, enrich_scan(events, catalog))

    def test_benchmark_fixture_is_reproducible(self):
        self.assertEqual(make_data(100, 20), make_data(100, 20))
        events, catalog = make_data(100, 20)
        self.assertEqual((len(events), len(catalog)), (100, 40))
        self.assertEqual(sum(pid.startswith("missing-") for _, pid in events), 20)
        self.assertEqual(enrich_scan(events, catalog), enrich_indexed(events, catalog))


if __name__ == "__main__":
    unittest.main()
The accompanying local test run passed seven tests, including 250 deterministic generated comparisons and a check that rejects a deliberately incorrect last-duplicate-wins candidate. That result applies to the supplied code and tests. It does not mean that DeepSeek executed the tests or that your application’s integration behavior has been checked. Rerun the suite after copying or adapting the example.
Add differential testing after the hand-written expectations. Generate many small catalogs and event lists with a deterministic generator, then compare enrich_indexed with enrich_scan. Bias some cases toward duplicates, missing products, and repeated events instead of trusting uniform randomness to discover them. Preserve any failing seed and reduce the case until the discrepancy is easy to understand. The baseline acts as a comparison oracle, while the independent examples protect you against two implementations sharing the same mistaken assumption.
Passing these tests supports equivalence over the stated domain; it is not a proof for arbitrary Python objects or all application behavior. Keep this distinction visible in the review. DeepSeek can suggest a missing edge case or explain a failing comparison, but a proposed test is not a passed test. If you use synthetic test-data techniques, preserve the generator and its constraints with the experiment so another developer can reproduce the same coverage.
9. Include index construction in the one-off benchmark
The main comparison is a complete call to enrich_scan(events, catalog) against a complete call to enrich_indexed(events, catalog). The candidate builds its dictionary inside every timed invocation. Dataset generation happens beforehand for both versions. This answers a concrete question: given two already available input lists, what does it cost to produce the enriched output once? It does not answer the cost of reading files, receiving a request, or updating a database.
python performance_lab.py time
python performance_lab.py time --events 1 --products 1000
Expand the timing harness from performance_lab.py
def time_calls(events, catalog, repeat: int, number: int):
    # Untimed warm-up/equality check; each timed indexed call rebuilds its index.
    assert enrich_scan(events, catalog) == enrich_indexed(events, catalog)
    best = {}
    for fn in (enrich_scan, enrich_indexed):
        timer = timeit.Timer(lambda: fn(events, catalog))
        calls = number or timer.autorange()[0]  # Aim for >= 0.2 s per repeat.
        samples = timer.repeat(repeat=repeat, number=calls)
        milliseconds = [sample * 1000 / calls for sample in samples]
        print(f"{fn.__name__}: calls/repeat={calls}")
        best[fn.__name__] = min(milliseconds)
        print(f"{fn.__name__}: ms/call = {[round(x, 4) for x in milliseconds]}")
        print(f"  best = {min(milliseconds):.4f} ms/call")
    ratio = best["enrich_scan"] / best["enrich_indexed"]
    print(f"best-time ratio (scan/indexed) = {ratio:.2f}x")
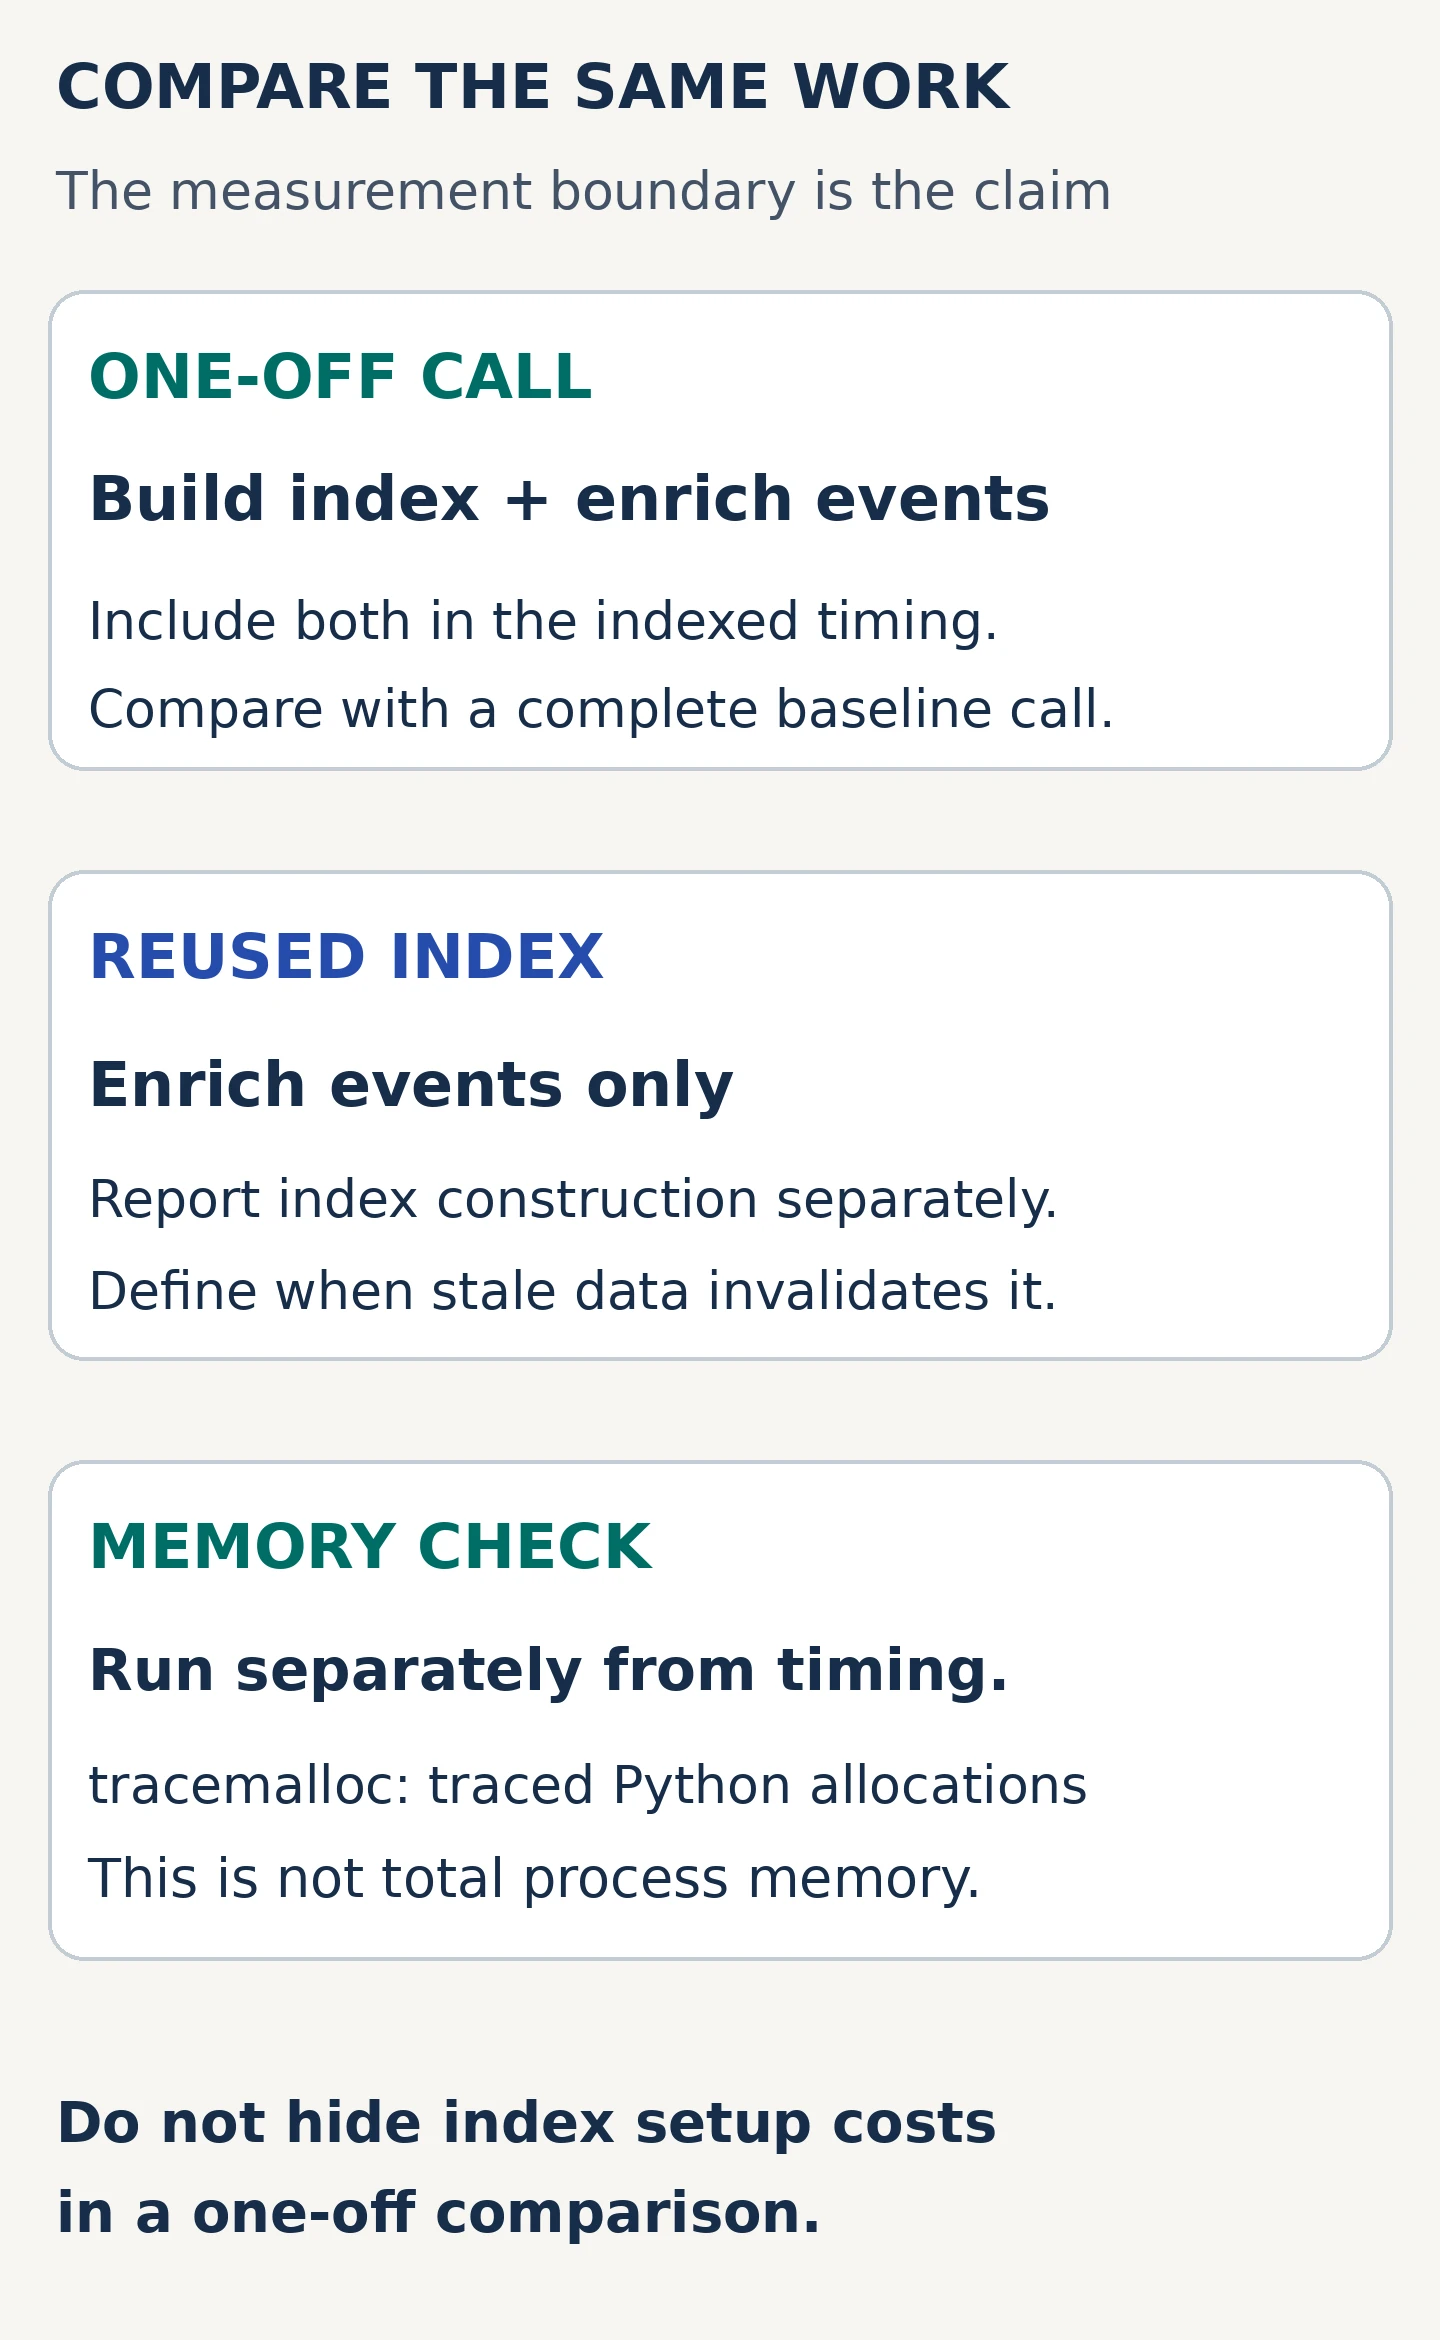
Putting index construction in a benchmark’s untimed setup would change the question. Such a benchmark could be appropriate for an application that genuinely builds one index and uses it for many batches, but its label must say that reuse is assumed. The example here does not implement or benchmark a reused-index interface. Treat reuse as a separate extension whose benefit, construction cost, storage cost, and invalidation behavior require their own evaluation.
For that future design, distinguish build time, per-batch lookup time, and the number of batches served before rebuilding. A catalog refreshed for every batch has little opportunity to amortize construction. A stable catalog shared across many batches may have more. Define how a batch obtains a consistent catalog version and what happens during replacement. Otherwise a benchmark that saves construction time can conceal a correctness problem in which different events observe different catalog states.
Keep result handling fair as well. Both functions should produce the same materialized output type and do the same required work. Do not compare a fully consumed list against a lazy iterator that has not executed yet. If a real caller retains many outputs at once, add an experiment with that lifetime. Your baseline and candidate must have matching setup, execution, and consumption boundaries before their numbers support a useful comparison.
10. Repeat timings and report the conditions
timeit repeats a statement and can return several timed batches. Divide each batch duration by its number of calls to express time per invocation. Its setup is excluded, and it normally disables cyclic garbage collection while timing. Python’s documentation recommends inspecting the full repeat vector and treats the smallest value as a useful lower-bound estimate for a small snippet under favorable conditions. Keep those properties in mind when labeling the result.
A lowest repeated time is not a production latency percentile. It describes the best observed batch in that local experiment, with much of the surrounding application absent. Keep the individual repeated values so obvious instability is visible. If the candidate’s advantage is comparable to the variation between runs, collect better evidence before calling it a win. A different run order or a quieter machine may reveal that an apparent improvement was ordinary environmental noise.
State the garbage-collection policy. Disabling cyclic collection does not mean every kind of object cleanup has been disabled. If cyclic collection contributes to your application’s cost, run a separately labeled comparison with it enabled and keep that policy consistent between versions. Do not combine results from different policies into a single ratio. This example’s tuples and strings keep the object model simple, but that simplicity should not become an unstated assumption when the pattern is moved into a larger system.
Measure several workload shapes and report absolute times alongside any ratio. Reversing the catalog may change scan behavior while leaving the indexed lookup phase broadly similar, but duplicates make reversal a semantic change to the data; regenerate and verify expected behavior for that workload rather than casually mutating a shared fixture. Include small inputs where setup can dominate. Avoid rounding a tiny difference into a dramatic percentage, and never ask DeepSeek to fill missing timing cells with plausible estimates.
In the recorded CPython 3.12.14 Linux run, the default fixture’s best repeated complete-call times were 78.5329 milliseconds for the scan and 0.4449 milliseconds for indexing. A separate one-event fixture, with one unknown product against the same 2,000 catalog rows, reversed the outcome: 0.0327 milliseconds for scanning and 0.0647 milliseconds for indexing. These are actual local observations from a shared, unpinned environment. They reuse prebuilt input objects after warm-up, and they measure no production I/O or DeepSeek execution. The small-batch result is an important boundary on the larger-batch improvement.
Expand the recorded timing repeats
These are the original captured runs, not promised outcomes. The timing harness selects call counts independently, divides each repeat by its count, and prints milliseconds per call.
Python 3.12.14 (CPython)
Platform: Linux 6.18.44 x86_64
events=6000, catalog_rows=2000, seed=20261004
repeat=5, requested number=0; timeit default GC policy
enrich_scan: calls/repeat=5
enrich_scan: ms/call = [80.0684, 78.5329, 83.1295, 102.9521, 92.4049]
  best = 78.5329 ms/call
enrich_indexed: calls/repeat=500
enrich_indexed: ms/call = [0.4947, 0.4497, 0.4449, 0.4734, 0.4993]
  best = 0.4449 ms/call
best-time ratio (scan/indexed) = 176.53x
Python 3.12.14 (CPython)
Platform: Linux 6.18.44 x86_64
events=1, catalog_rows=2000, seed=20261004
repeat=5, requested number=0; timeit default GC policy
enrich_scan: calls/repeat=10000
enrich_scan: ms/call = [0.034, 0.0332, 0.0327, 0.0332, 0.0358]
  best = 0.0327 ms/call
enrich_indexed: calls/repeat=5000
enrich_indexed: ms/call = [0.0652, 0.0676, 0.065, 0.0647, 0.0672]
  best = 0.0647 ms/call
best-time ratio (scan/indexed) = 0.51x
For a wider application measurement, time.perf_counter measures elapsed duration, including waiting. Record it separately from CPU-time measurements and from the instrumented profile. The name and unit of a metric should tell the reader what was observed. “Faster” becomes meaningful only after the operation, workload, clock, and measurement policy are clear.
11. Measure allocation cost separately from runtime
Indexing trades repeated search work for an additional data structure. Use a separate tracemalloc run to investigate Python allocations. Its current and peak values describe traced memory blocks; they are not the process’s resident set size. Start tracing at the boundary you intend to study, keep that boundary identical between implementations, and state which inputs already existed. Allocations made before tracing began are outside that local observation.
python performance_lab.py memory
Expand the allocation harness from performance_lab.py
def memory_call(fn, events, catalog):
    gc.collect()
    tracemalloc.start()
    result = fn(events, catalog)  # Keep output alive until after measurement.
    current, peak = tracemalloc.get_traced_memory()
    tracemalloc.stop()
    print(f"{fn.__name__}: rows={len(result)}, current={current} B, peak={peak} B")
Keep the returned output alive until the measurement is collected when you want to observe its retained allocation. In the indexed function, the temporary dictionary can disappear after the function returns while its allocation still contributes to the recorded peak. That difference between current and peak helps explain a candidate that uses more temporary working memory without retaining an index. It does not establish how much physical memory the operating system will immediately reclaim.
In the separate recorded default-fixture allocation run, peak traced bytes were 437,128 for the scan and 463,280 for the indexed implementation. The prebuilt inputs were excluded, and the returned output remained alive when each measurement was read. The modest difference in this example is a local observation, not a capacity estimate for a server. Repeat the measurement with your catalog and output sizes before accepting the tradeoff.
Separate the memory investigation from the timing benchmark because tracing changes the execution conditions. If a memory figure appears beside a runtime figure, explain that they come from different runs of the same workload. A snapshot comparison can help identify where retained allocations originated, but a transient peak and a retained growth pattern answer different questions. Repeatedly increasing retained memory across batches deserves its own investigation rather than being dismissed as the inevitable cost of a dictionary.
For a deployment memory limit, also use an appropriate process-level or container-level measurement in the target environment. Python’s resource documentation identifies ru_maxrss as a maximum resident-set measure on supported systems, but such a lifetime maximum is not interchangeable with a fresh per-operation allocation peak. Use isolated runs and verify the platform’s units and semantics before comparing it. Native-library buffers, interpreter state, and other process memory can matter even when the traced Python allocation figure looks comfortable.
Let the memory budget influence the decision rather than treating it as an appendix to a speed result. A local improvement may be unacceptable when many worker processes each build an index at the same time. If that is the deployment pattern, reproduce its concurrency and catalog sizes in the later system test. The single-call example identifies a tradeoff; it cannot decide a service’s total capacity on its own.
12. Use Amdahl’s arithmetic to set realistic expectations
A local speedup has a ceiling on its effect on a larger job. Consider an explicitly illustrative calculation, not a benchmark result: enrichment takes 40 percent of a job’s original duration, and a replacement makes that portion four times as fast. The unchanged work still takes 60 percent, while enrichment now takes 10 percent. Total duration becomes 70 percent of the original, giving a whole-job speedup of approximately 1.43 times. The job does not become four times faster.
The same reasoning gives a useful upper bound before implementation. If the 40 percent portion could somehow take no time at all, the remaining 60 percent would still limit the speedup to about 1.67 times. These numbers are chosen solely to demonstrate the arithmetic. Apply the calculation to your own measured fraction only when the workload and execution boundaries match, and remember that the calculation assumes the rest of the work stays unchanged.
In practice, surrounding costs can change. A faster stage can expose a downstream bottleneck, alter buffering, or change how much work is queued. Increased working memory can influence the rest of the process. After the isolated experiment, rerun the larger operation without profiling or allocation tracing and compare the metric that motivated the task. If the end-to-end result fails to improve enough, that is useful evidence even when the local function clearly improved.
This step also helps prioritize the next investigation. If enrichment now meets its budget and serialization dominates, stop polishing the lookup loop. If total runtime barely moved, revisit the original performance objective instead of advertising the local ratio as the application result. The purpose of the calculation is to connect developer effort to a user-visible constraint and prevent a narrow measurement from carrying a broader claim than it supports.
13. Ask DeepSeek to review a decision record
After testing and measuring, prepare a short decision record. State the contract, patch scope, environment, workload families, exact commands, test results, and raw measurement locations. Summarize what improved, what became more expensive, and which situations remain unmeasured. Keep observations separate from explanations. For example, a measured reduction in complete-call duration is an observation; attributing every part of that reduction to a particular low-level interpreter mechanism would need additional evidence.
Ask DeepSeek to look for contradictions in that record. Does the stated first-duplicate rule match the implementation? Does the timing include index construction? Are both output lists materialized? Is a traced allocation peak being described as process memory? Does a whole-job claim rely only on a microbenchmark? These questions focus the model on reviewable evidence rather than inviting it to produce a persuasive success story.
Preserve negative results. If small batches favor the scan, include them. If a workload varies too much to support a conclusion, label it inconclusive and identify what would improve the measurement. If a proposed test was never run, keep it in the remaining-work section. A clean record makes it easier for a teammate to challenge or reproduce the decision without needing the entire AI conversation. The same discipline applies to a broader DeepSeek-assisted code review.
The publishable claim should be no wider than the evidence. You can say that a particular implementation passed specified local tests and had specified measured behavior under a documented environment. You cannot infer that every Python program benefits from indexing, that a model executed your code, or that a synthetic dataset establishes production capacity. This lesson supplies a local methodology and a reproducible example, with no DeepSeek API execution and no fabricated conversation or benchmark transcript.
14. Ship only what the evidence supports
Make the patch easy to review and easy to reverse. Keep the reference implementation or its behavioral tests available, document why first-match preservation matters, and avoid mixing unrelated cleanup into the performance change. If the application permits a controlled rollout, compare the relevant production or staging metric with a clear baseline. Decide in advance which correctness signal, latency regression, or memory threshold would trigger investigation or rollback. The threshold should come from the application’s needs.
Watch for workload drift after release. A catalog that grows much larger, batches that become smaller, or a new pattern of misses can change the tradeoff. If someone later introduces index reuse, require a new review of invalidation and lifecycle behavior instead of treating it as a harmless extension. The original experiment is a record of a specific design under specific conditions, not permanent permission for every related optimization.
Before calling the work complete, check the following against saved evidence:
- The input domain, first-duplicate rule, missing-product output, empty labels, event order, and non-mutation requirement are explicit.
- Independent expected-output tests and deterministic differential tests ran successfully for the candidate.
- The one-off timing includes index construction, with identical workload and output-consumption boundaries for both versions.
- Repeat values, Python version, workload generation, machine context, and garbage-collection policy are recorded.
- Python allocation measurements are labeled separately from process memory and come from runs separate from timing.
- Any whole-job claim has whole-job evidence, and any illustrative arithmetic is clearly identified as illustrative.
- The deployment decision acknowledges unmeasured conditions and has a practical revert path.
The most reusable result is the investigation pattern: specify behavior, reproduce the cost, profile a relevant boundary, test one hypothesis, and measure it fairly. DeepSeek can help sharpen each question and find gaps in the argument. The evidence still comes from your program. When a candidate passes the behavioral checks and improves the metric that matters within the available memory budget, you have a defensible optimization. When it does not, you have learned enough to choose the next step without shipping a guess.
Sources and References
Primary documentation reviewed on October 4, 2026. Tool behavior was checked against the current Python documentation; readers should also consult the documentation for their installed Python version.
- Python documentation: The Python Profilers — deterministic profiling, report columns, cumulative and internal time, and the separation between profiling and benchmarking.
- Python documentation: timeit — setup boundaries, repetitions, result interpretation, and cyclic garbage-collection behavior.
- Python documentation: tracemalloc — traced Python allocations, current and peak measurements, and snapshots.
- Python documentation: dictionary setdefault — retention of an existing key’s value.
- Python documentation: CPython dictionary implementation — hash-table lookup assumptions behind the expected-complexity discussion.
- Python documentation: unittest — assertions and subtests for executable correctness checks.
- Python documentation: perf_counter — elapsed-duration timing and clock semantics.
- Python documentation: resource usage — platform-dependent process resource reporting and maximum resident set size.
- DeepSeek official API documentation — current service integration documentation; no API call is required or demonstrated in this lesson.
